Monitoring Framework
Use Prometheus and Grafana to build the TiKV monitoring framework.
The TiKV monitoring framework adopts two open-source projects: Prometheus and Grafana. TiKV uses Prometheus to store the monitoring and performance metrics, and uses Grafana to visualize these metrics.
About Prometheus in TiKV
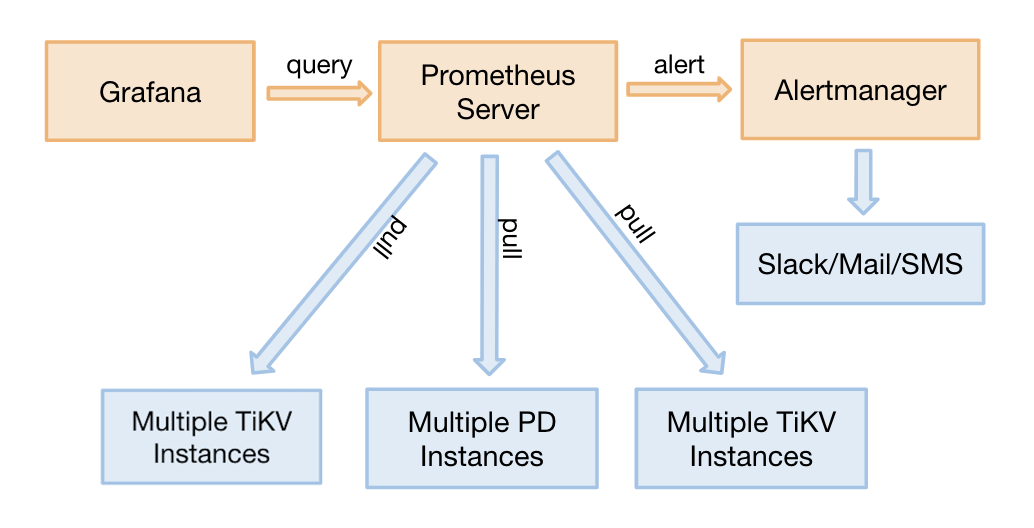
Prometheus is a time-series database and has a multi-dimensional data model and flexible query language. Prometheus consists of multiple components. Currently, TiKV uses the following components:
- Prometheus Server: to scrape and store time series data
- Client libraries: to customize necessary metrics in the application
- AlertManager: for the alerting mechanism
About Grafana in TiKV
Grafana is an open-source project for analyzing and visualizing metrics. TiKV uses Grafana to display the performance metrics.