Each Region has three replicas according to the default configuration.
Fault Tolerance and Recovery
Learn how TiKV recovers from failures.
This document walks you through a demonstration of how TiKV recovers from failures and continues providing services when some nodes fail. You can follow the steps of this demonstration and perform operations on your own. In this way, you will have a hands-on experience of the fault tolerance feature of TiKV.
The demonstration consists of two experiments: a single-node failure simulation, where one node is taken offline, and then a two-node failure, where two TiKV nodes are simultaneously taken offline. In both failures, the cluster repairs itself by re-replicating missing data to other nodes, and you can see how the cluster continues running uninterrupted.
The process is as follows:
- Prepare a TiKV cluster for test.
- Run a workload against TiKV.
- Experiment 1: Simulate a single-node failure.
- Experiment 2: Simulate two simultaneous node failures.
- Clean up the test cluster.
Prepare a TiKV cluster for test
Before the process of failure simulation begins, the following requirements are already met:
- TiUP is installed (v1.5.2 or later) as described in TiKV in 5 Minutes.
- client-py is installed. It is used to interact with the TiKV cluster.
Step 1. Start a six-node cluster
Use the tiup playground command to start a six-node local TiKV cluster:
tiup playground --mode tikv-slim --kv 6
The output of this command will show the components’ addresses. These addresses will be used in the following steps.
Playground Bootstrapping...
Start pd instance
Start tikv instance
Start tikv instance
Start tikv instance
Start tikv instance
Start tikv instance
Start tikv instance
PD client endpoints: [127.0.0.1:2379]
To view the Prometheus: http://127.0.0.1:44549
To view the Grafana: http://127.0.0.1:3000
Step 2. Import data to TiKV
Start a new terminal session, and use go-ycsb to launch a workload of writing data to the TiKV cluster.
Clone
go-ycsbfrom GitHub.git clone https://github.com/pingcap/go-ycsb.gitBuild the application from the source.
makeLoad a workload using
go-ycsbwith 10000 keys into the TiKV cluster../bin/go-ycsb load tikv -P workloads/workloada -p tikv.pd="127.0.0.1:2379" -p tikv.type="raw" -p recordcount=1000000The expected output is as follows:
Run finished, takes 11.722575701s
INSERT - Takes(s): 11.7, Count: 10000, OPS: 855.2, Avg(us): 18690, Min(us): 11262, Max(us): 61304, 99th(us): 36000, 99.9th(us): 58000, 99.99th(us): 62000
Step 3: Verify the data import
Use the client-py tool to verify the data imported in the last step. Note that the Python 3.5+ REPL environment is required for such verification. It is expected that the key count in the output matches the recordcount in the go-ycsb command in the previous step.
>>> from tikv_client import RawClient
>>> client = RawClient.connect("127.0.0.1:2379")
>>> len(client.scan_keys(None, None, 10000))
10000
The evaluation of the last expression should be 10000, as the recordcount has specified in the go-ycsb command.
Run a workload against TiKV
Step 1. Run a sample workload
Enter the source directory of go-ycsb and use the following command to run the workloada from the YCSB benchmark.
workloada simulates multiple client connections and performs a mix of reads (50%) and writes (50%) per connection.
./bin/go-ycsb run tikv -P workloads/workloada -p tikv.pd="127.0.0.1:2379" -p tikv.type="raw" -p tikv.conncount=16 -p threadcount=16 -p recordcount=10000 -p operationcount=1000000
Per-operation statistics are printed to the standard output every second.
...
READ   - Takes(s): 10.0, Count: 7948, OPS: 796.2, Avg(us): 395, Min(us): 72, Max(us): 20545, 99th(us): 2000, 99.9th(us): 19000, 99.99th(us): 21000
UPDATE - Takes(s): 10.0, Count: 7945, OPS: 796.8, Avg(us): 19690, Min(us): 11589, Max(us): 40429, 99th(us): 34000, 99.9th(us): 41000, 99.99th(us): 41000
READ   - Takes(s): 20.0, Count: 15858, OPS: 793.6, Avg(us): 380, Min(us): 68, Max(us): 20545, 99th(us): 2000, 99.9th(us): 3000, 99.99th(us): 21000
UPDATE - Takes(s): 20.0, Count: 15799, OPS: 791.1, Avg(us): 19834, Min(us): 10505, Max(us): 41090, 99th(us): 35000, 99.9th(us): 40000, 99.99th(us): 41000
...
This workload above runs for several minutes, which is enough time to simulate a node failure described as follows.
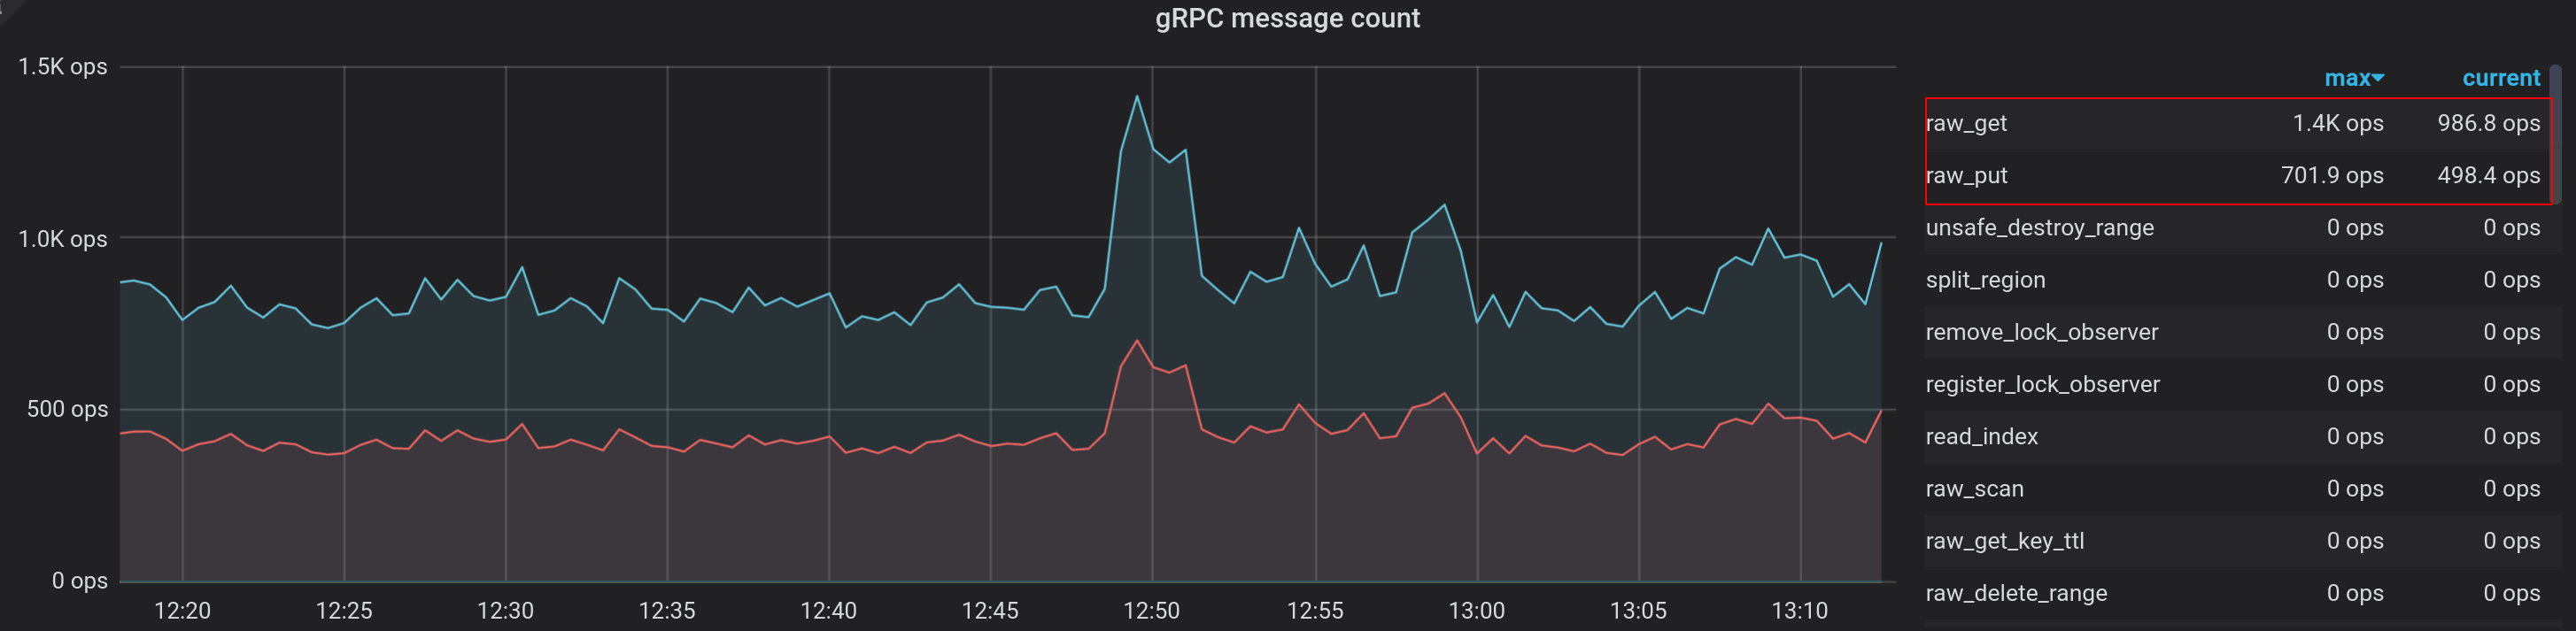
Step 2. Check the workload on Grafana dashboard
Open the Grafana dashboard by accessing
http://127.0.0.1:3000in your browser.Log into the dashboard using the default username
adminand passwordadmin.Enter the dashboard playground-tikv-summary, and the OPS information is in the panel gRPC message count in the row gRPC.
By default, TiKV replicates all data three times and balances the load across all stores. To see this balancing process, enter the page playground-overview and check the Region count across all nodes. In this example, a small amount of data is loaded. Thus only one Region is shown:

Experiment 1: Simulate a single-node failure
Step 1: Stop the target process
In TiKV, all read/write operations are handled by the leader of the Region group. See architecture for details.
In this example, the only one leader in the cluster is stopped. Then the load continuity and cluster health are checked.
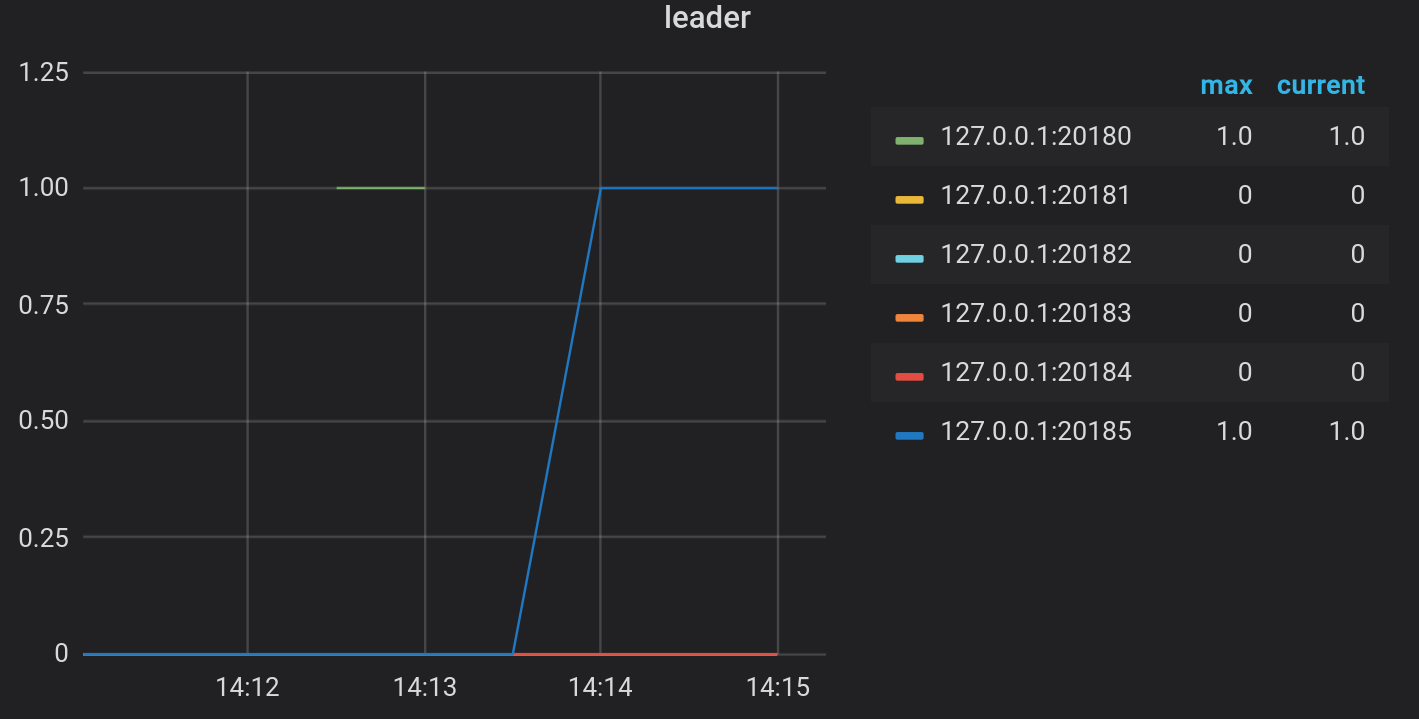
Enter the Grafana dashboard playground-overview. The leader distribution is shown in the panel leader in row TiKV.
In this example, the local process that opens the port
20180holds only one leader in the cluster. Execute the following command to stop this process.kill -STOP $(lsof -i:20180 | grep tikv | head -n1 | awk '{print $2}')
Step 2. Check the load continuity and cluster health on Grafana dashboard
Check the leader distribution on the dashboard again. The monitoring metric shows that the leader is moved to another store.
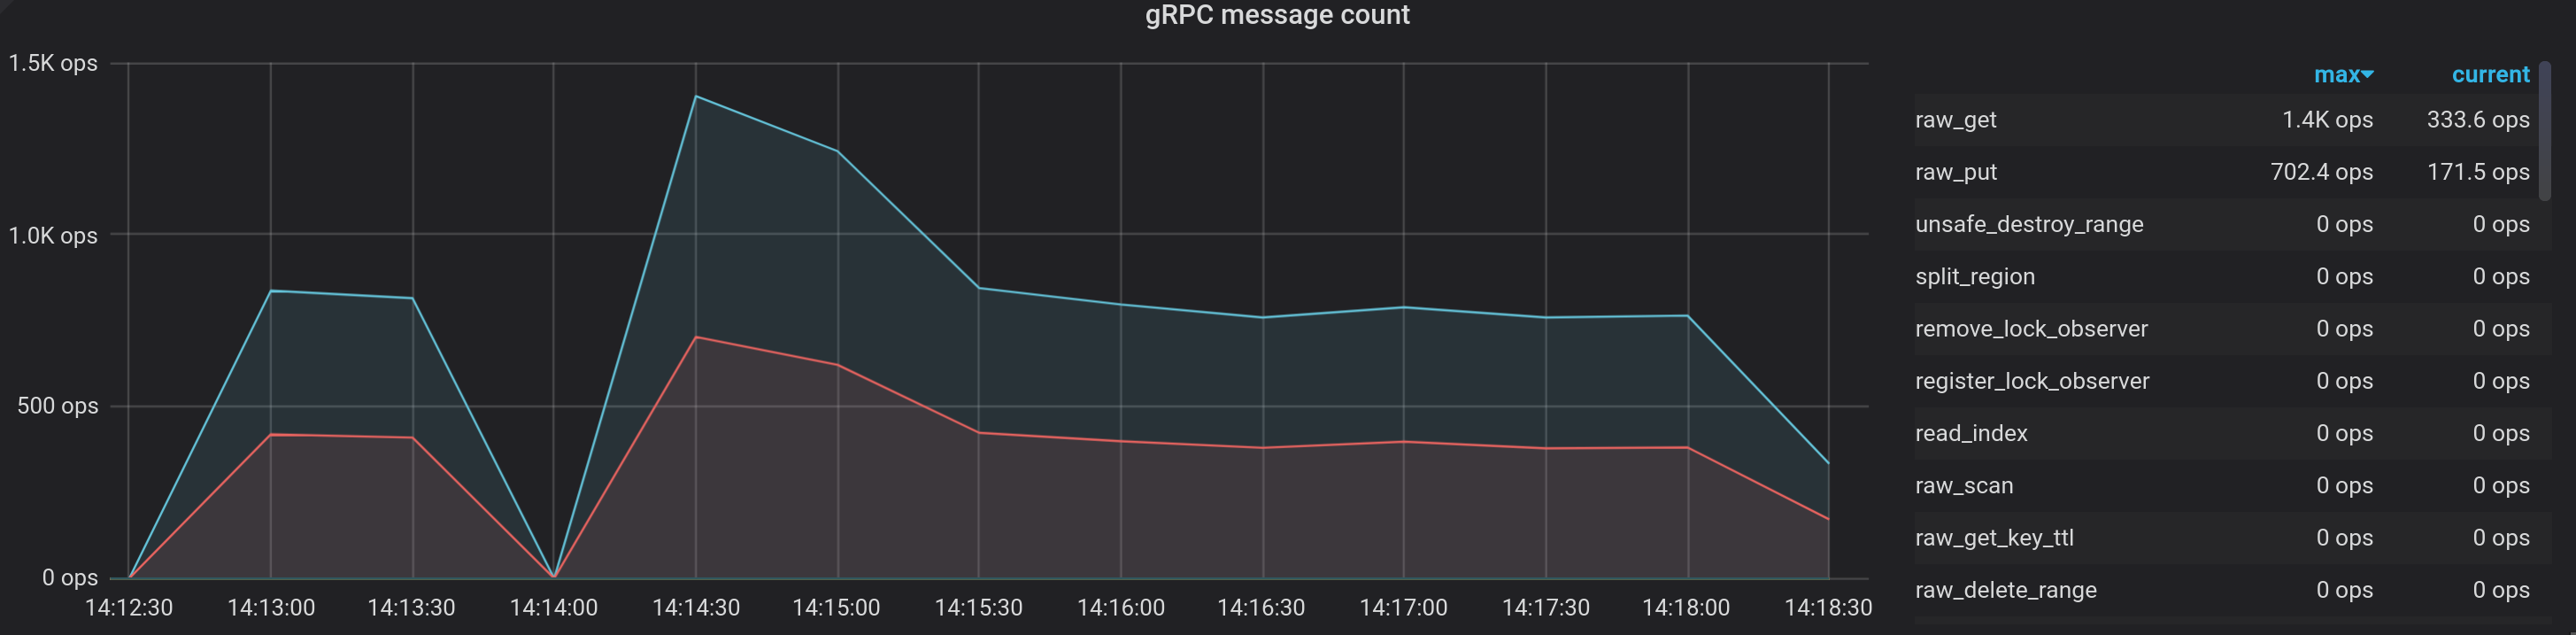
Check the gRPC OPS. The monitoring metric shows that there is a short duration in which the TiKV instance is unavailable because the leader is down. However, the workload is back online as soon as the leader election is completed.
Experiment 2: Simulate two simultaneous node failures
Step 1: Stop the target processes
In the above single-node failure simulation, the TiKV cluster has recovered. The leader of the cluster has been stopped, so there are five stores alive. Then, a new leader is elected after a while.
Experiment 2 will increase the Region replicas of TiKV to five, stop two non-leader nodes simultaneously, and check the cluster status.
The component version should be explicitly specified in the
tiup ctl command. In the following example, the component version is v5.1.0.Increase the replicas of the cluster to five:
tiup ctl:v5.1.0 pd config set max-replicas 5Stop two non-leader nodes simultaneously. In this example, the processes that hold the ports
20181and20182are stopped. The process IDs (PIDs) are1009934and109941.kill -STOP 1009934 kill -STOP 1009941
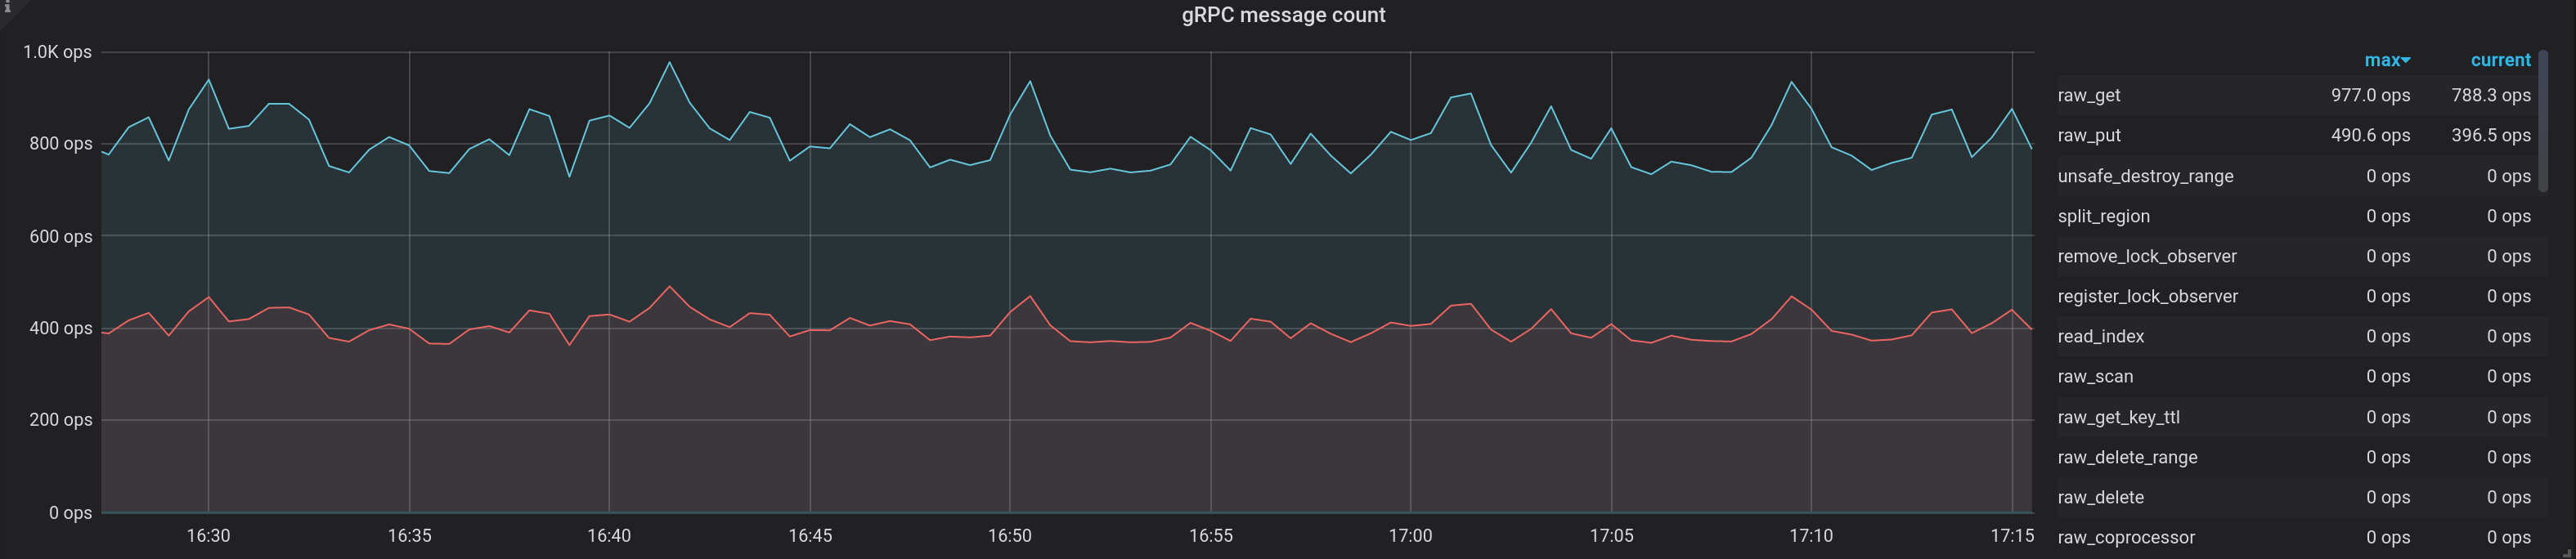
Step 2: Check the load continuity and cluster health on Grafana dashboard
Similar to Step 2. Check the load continuity and cluster health on Grafana dashboard in the single-node failure simulation, enter the Grafana dashboard and follow playground-tikv-summary -> gRPC -> gRPC message count. The metrics show that the workload continuity is not impacted because the leader is still alive.
To further verify the load continuity and cluster health,
client-pyis used to read and write some data to prove that the cluster is still available.>>> from tikv_client import RawClient >>> client = RawClient.connect("127.0.0.1:2379") >>> len(client.scan_keys(None, None, 10240)) 10000 >>> client.put(b'key', b'value') >>> len(client.scan_keys(None, None, 10240)) 10001
Clean up the test cluster
After experiment 2 is finished, you might need to clean up the test cluster. To do that, take the following steps:
Go back to the terminal session that you have just started the TiKV cluster and press ctrl + c and wait for the cluster to stop.
After the cluster is stopped, destroy the cluster using the following command:
tiup clean --all