You must add the Prometheus Pushgateway addresses to the startup parameters of the PD and TiKV components.
Monitoring a Cluster
Learn how to monitor the state of a TiKV cluster.
Currently, you can use two types of interfaces to monitor the state of the TiKV cluster:
- The component state interface: use the HTTP interface to get the internal information of a component, which is called the component state interface.
- The metrics interface: use the Prometheus interface to record the detailed information of various operations in the components, which is called the metrics interface.
The component state interface
You can use this type of interface to monitor the basic information of components. This interface can get the details of the entire TiKV cluster and can act as the interface to monitor Keepalive.
The PD server
The API address of the Placement Driver (PD) is http://${host}:${port}/pd/api/v1/${api_name}
The default port number is 2379.
For detailed information about various API names, see PD API doc.
You can use the interface to get the state of all the TiKV instances and the information about load balancing. It is the most important and frequently-used interface to get the state information of all the TiKV nodes. See the following example for the information about a 3-instance TiKV cluster deployed on a single machine:
curl http://127.0.0.1:2379/pd/api/v1/stores
{
  "count": 3,
  "stores": [
    {
      "store": {
        "id": 1,
        "address": "127.0.0.1:20161",
        "version": "2.1.0-rc.2",
        "state_name": "Up"
      },
      "status": {
        "capacity": "937 GiB",
        "available": "837 GiB",
        "leader_weight": 1,
        "region_count": 1,
        "region_weight": 1,
        "region_score": 1,
        "region_size": 1,
        "start_ts": "2018-09-29T00:05:47Z",
        "last_heartbeat_ts": "2018-09-29T00:23:46.227350716Z",
        "uptime": "17m59.227350716s"
      }
    },
    {
      "store": {
        "id": 2,
        "address": "127.0.0.1:20162",
        "version": "2.1.0-rc.2",
        "state_name": "Up"
      },
      "status": {
        "capacity": "937 GiB",
        "available": "837 GiB",
        "leader_weight": 1,
        "region_count": 1,
        "region_weight": 1,
        "region_score": 1,
        "region_size": 1,
        "start_ts": "2018-09-29T00:05:47Z",
        "last_heartbeat_ts": "2018-09-29T00:23:45.65292648Z",
        "uptime": "17m58.65292648s"
      }
    },
    {
      "store": {
        "id": 7,
        "address": "127.0.0.1:20160",
        "version": "2.1.0-rc.2",
        "state_name": "Up"
      },
      "status": {
        "capacity": "937 GiB",
        "available": "837 GiB",
        "leader_count": 1,
        "leader_weight": 1,
        "leader_score": 1,
        "leader_size": 1,
        "region_count": 1,
        "region_weight": 1,
        "region_score": 1,
        "region_size": 1,
        "start_ts": "2018-09-29T00:05:47Z",
        "last_heartbeat_ts": "2018-09-29T00:23:44.853636067Z",
        "uptime": "17m57.853636067s"
      }
    }
  ]
}
The metrics interface
You can use this type of interface to monitor the state and performance of the entire cluster. The metrics data is displayed in Prometheus and Grafana. See Use Prometheus and Grafana for how to set up the monitoring system.
You can get the following metrics for each component:
The PD server
- the total number of times that the command executes
- the total number of times that a certain command fails
- the duration that a command succeeds
- the duration that a command fails
- the duration that a command finishes and returns result
The TiKV server
- Garbage Collection (GC) monitoring
- the total number of times that the TiKV command executes
- the duration that Scheduler executes commands
- the total number of times of the Raft propose command
- the duration that Raft executes commands
- the total number of times that Raft commands fail
- the total number of times that Raft processes the ready state
Use Prometheus and Grafana
This section introduces the deployment architecture of Prometheus and Grafana in TiKV, and how to set up and configure the monitoring system.
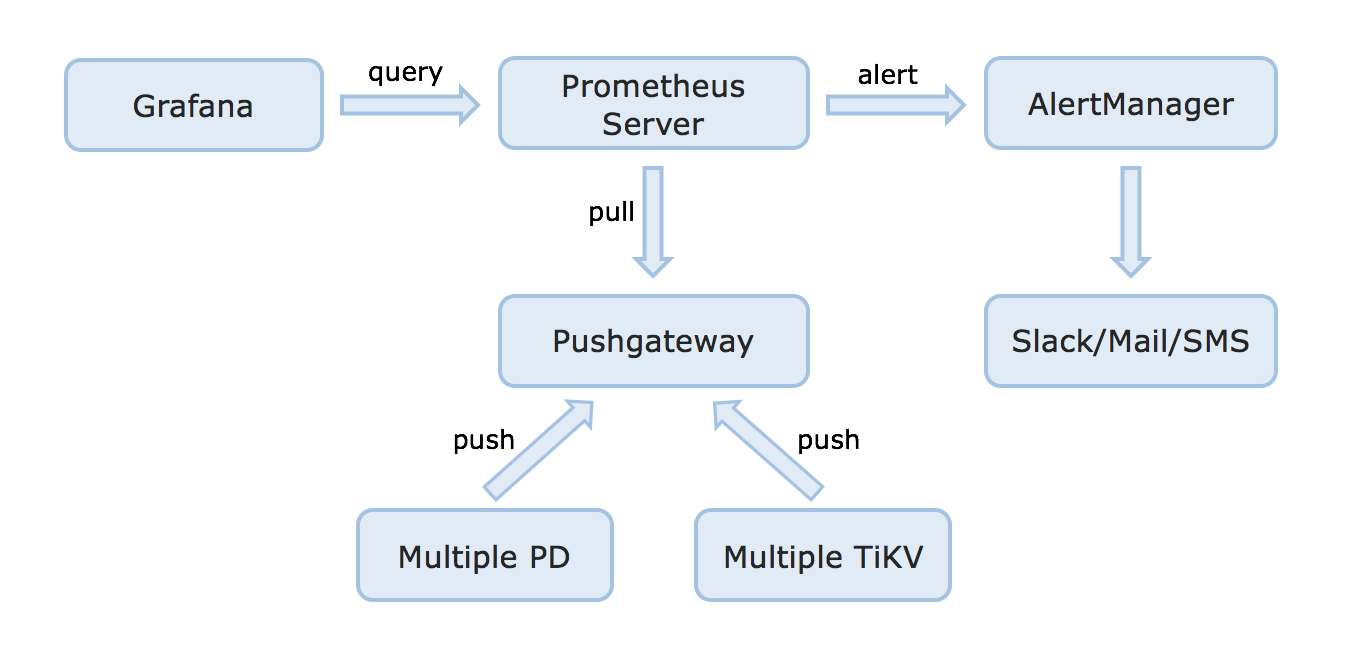
The deployment architecture
See the following diagram for the deployment architecture:
Set up the monitoring system
See the following links for your reference:
Manual configuration
This section describes how to manually configure PD and TiKV, PushServer, Prometheus, and Grafana.
Note: If your TiKV cluster is deployed using Ansible or Docker Compose, the configuration is automatically done, and generally, you do not need to configure it manually again. If your TiKV cluster is deployed using Docker, you can follow the configuration steps below.
Configure PD and TiKV
PD: update the
tomlconfiguration file with the Pushgateway address and the the push frequency:[metric] # prometheus client push interval, set "0s" to disable prometheus. interval = "15s" # prometheus pushgateway address, leaves it empty will disable prometheus. address = "host:port"TiKV: update the
tomlconfiguration file with the Pushgateway address and the the push frequency. Set thejobfield to"tikv".[metric] # the Prometheus client push interval. Setting the value to 0s stops Prometheus client from pushing. interval = "15s" # the Prometheus pushgateway address. Leaving it empty stops Prometheus client from pushing. address = "host:port" # the Prometheus client push job name. Note: A node id will automatically append, e.g., "tikv_1". job = "tikv"
Configure PushServer
Generally, you can use the default port 9091 and do not need to configure PushServer.
Configure Prometheus
Add the Pushgateway address to the yaml configuration file:
global:
  scrape_interval:     15s  # By default, scrape targets every 15 seconds.
  evaluation_interval: 15s  # By default, scrape targets every 15 seconds.
  # scrape_timeout is set to the global default value (10s).
    external_labels:
      cluster: 'test-cluster'
      monitor: "prometheus"

scrape_configs:
  - job_name: 'pd'
    honor_labels: true  # Do not overwrite job & instance labels.
    static_configs:
    - targets:
      - '192.168.199.113:2379'
      - '192.168.199.114:2379'
      - '192.168.199.115:2379'

  - job_name: 'tikv'
    honor_labels: true  # Do not overwrite job & instance labels.
    static_configs:
    - targets:
      - '192.168.199.116:20180'
      - '192.168.199.117:20180'
      - '192.168.199.118:20180'
Configure Grafana
Create a Prometheus data source
- Log in to the Grafana Web interface.
- Default address: http://localhost:3000
- Default account name:
admin - Default password:
admin
- Click the Grafana logo to open the sidebar menu.
- Click “Data Sources” in the sidebar.
- Click “Add data source”.
- Specify the data source information:
- Specify the name for the data source.
- For Type, select Prometheus.
- For Url, specify the Prometheus address.
- Specify other fields as needed.
- Click “Add” to save the new data source.
Create a Grafana dashboard
- Click the Grafana logo to open the sidebar menu.
- On the sidebar menu, click “Dashboards” -> “Import” to open the “Import Dashboard” window.
- Click “Upload .json File” to upload a JSON file (Examples can be found in
tidb-ansible). - Click “Save & Open”.
- A Prometheus dashboard is created.